 Movisure
Corporate Fleet Live
The total cost of ownership of a corporate fleet, calculated from what actually happens to each vehicle.
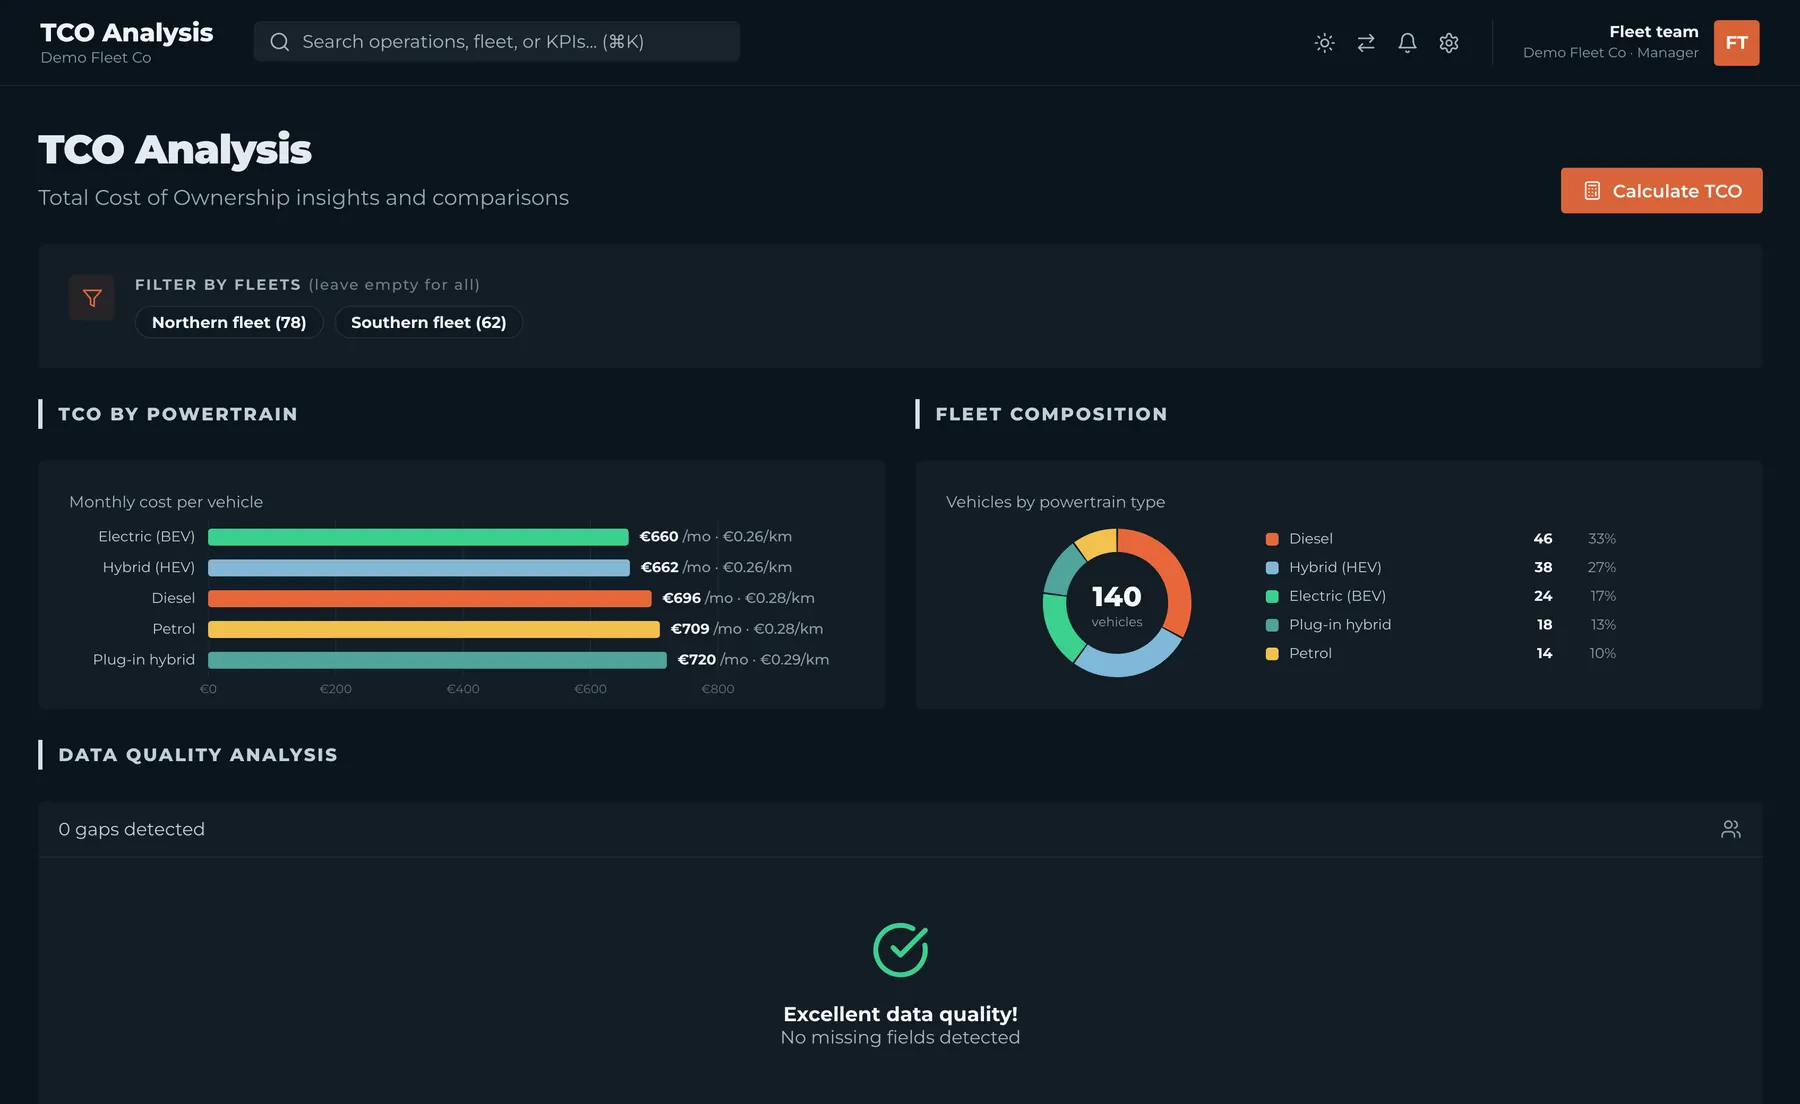
Every euro of cost, by component
Lease and finance, energy, maintenance, insurance, taxes and tolls, administration, downtime, incentives and CO₂e. Every euro is assigned to a named cost component, so you can compare fleets, periods and currencies. CO₂ analysis runs on the same calculation.
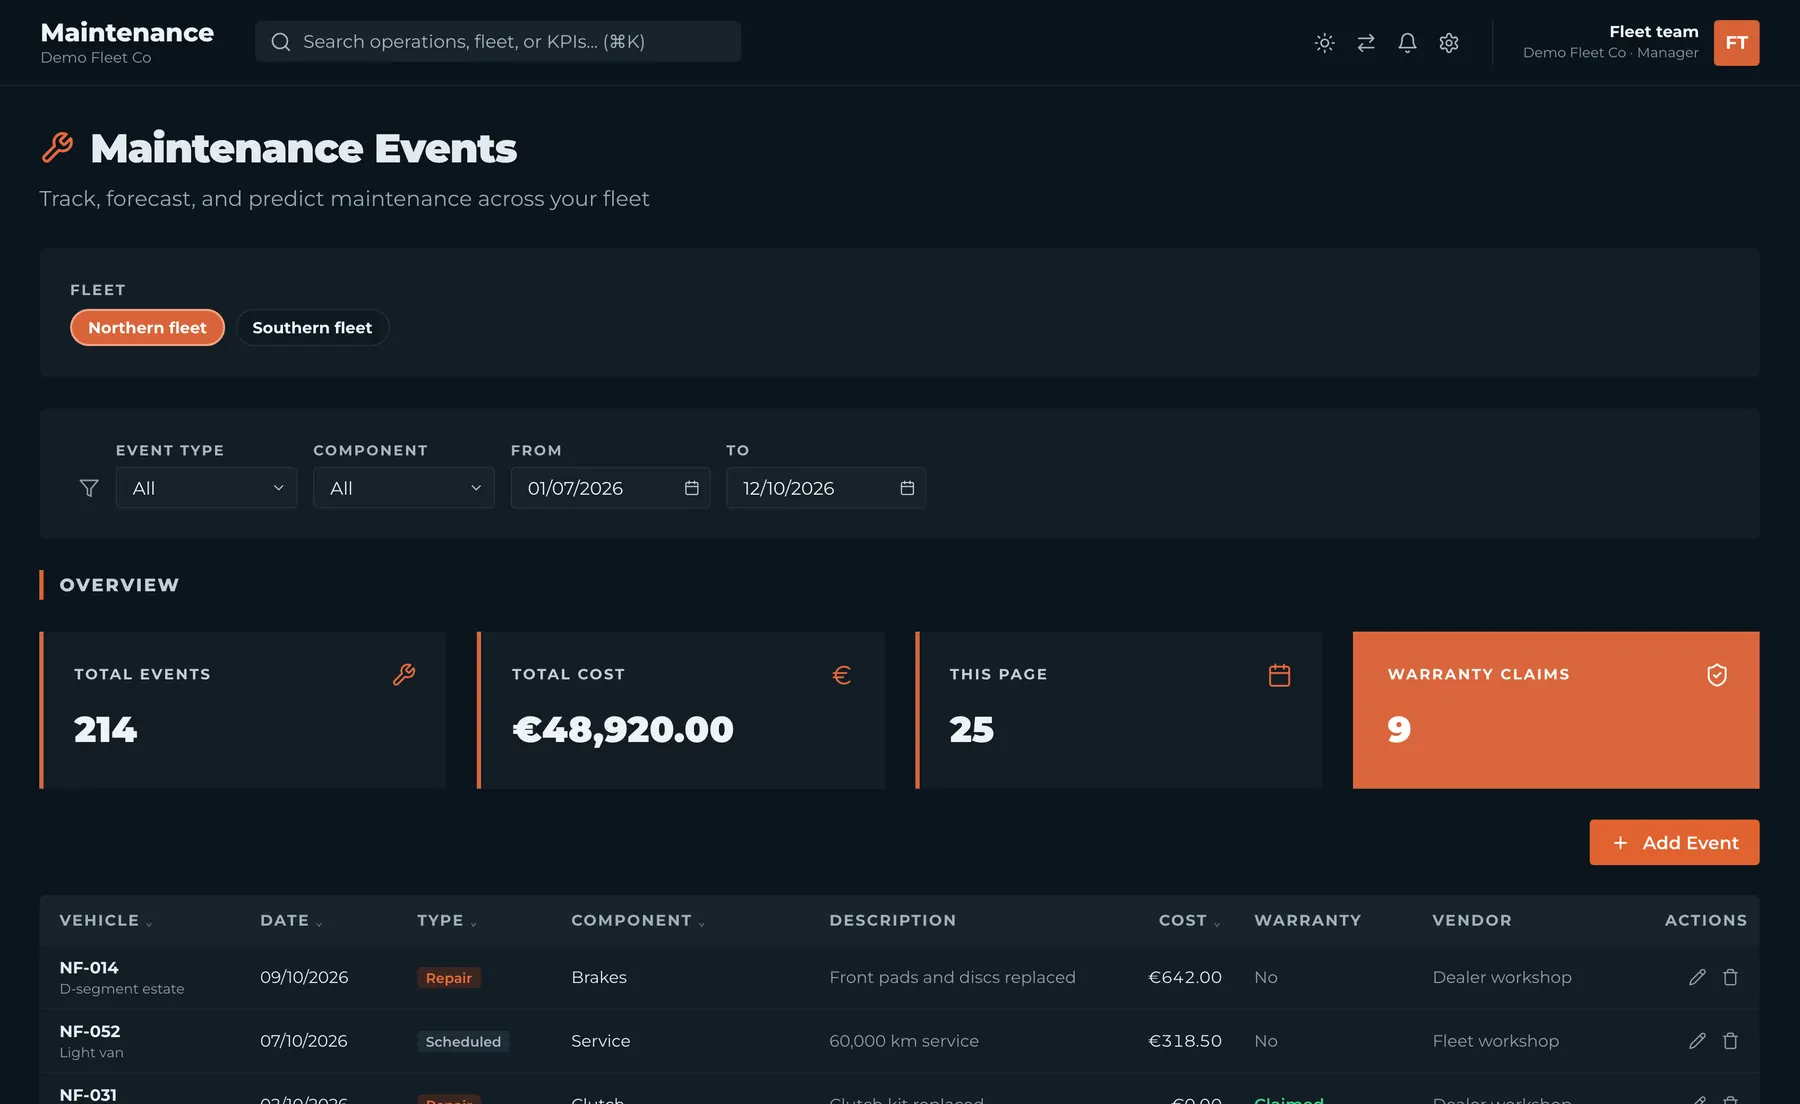
See the maintenance cost before the invoice arrives
Maintenance events build cost trends by component, a forecasting model projects what is coming, and predictive scheduling proposes a service slot before a breakdown chooses one for you.
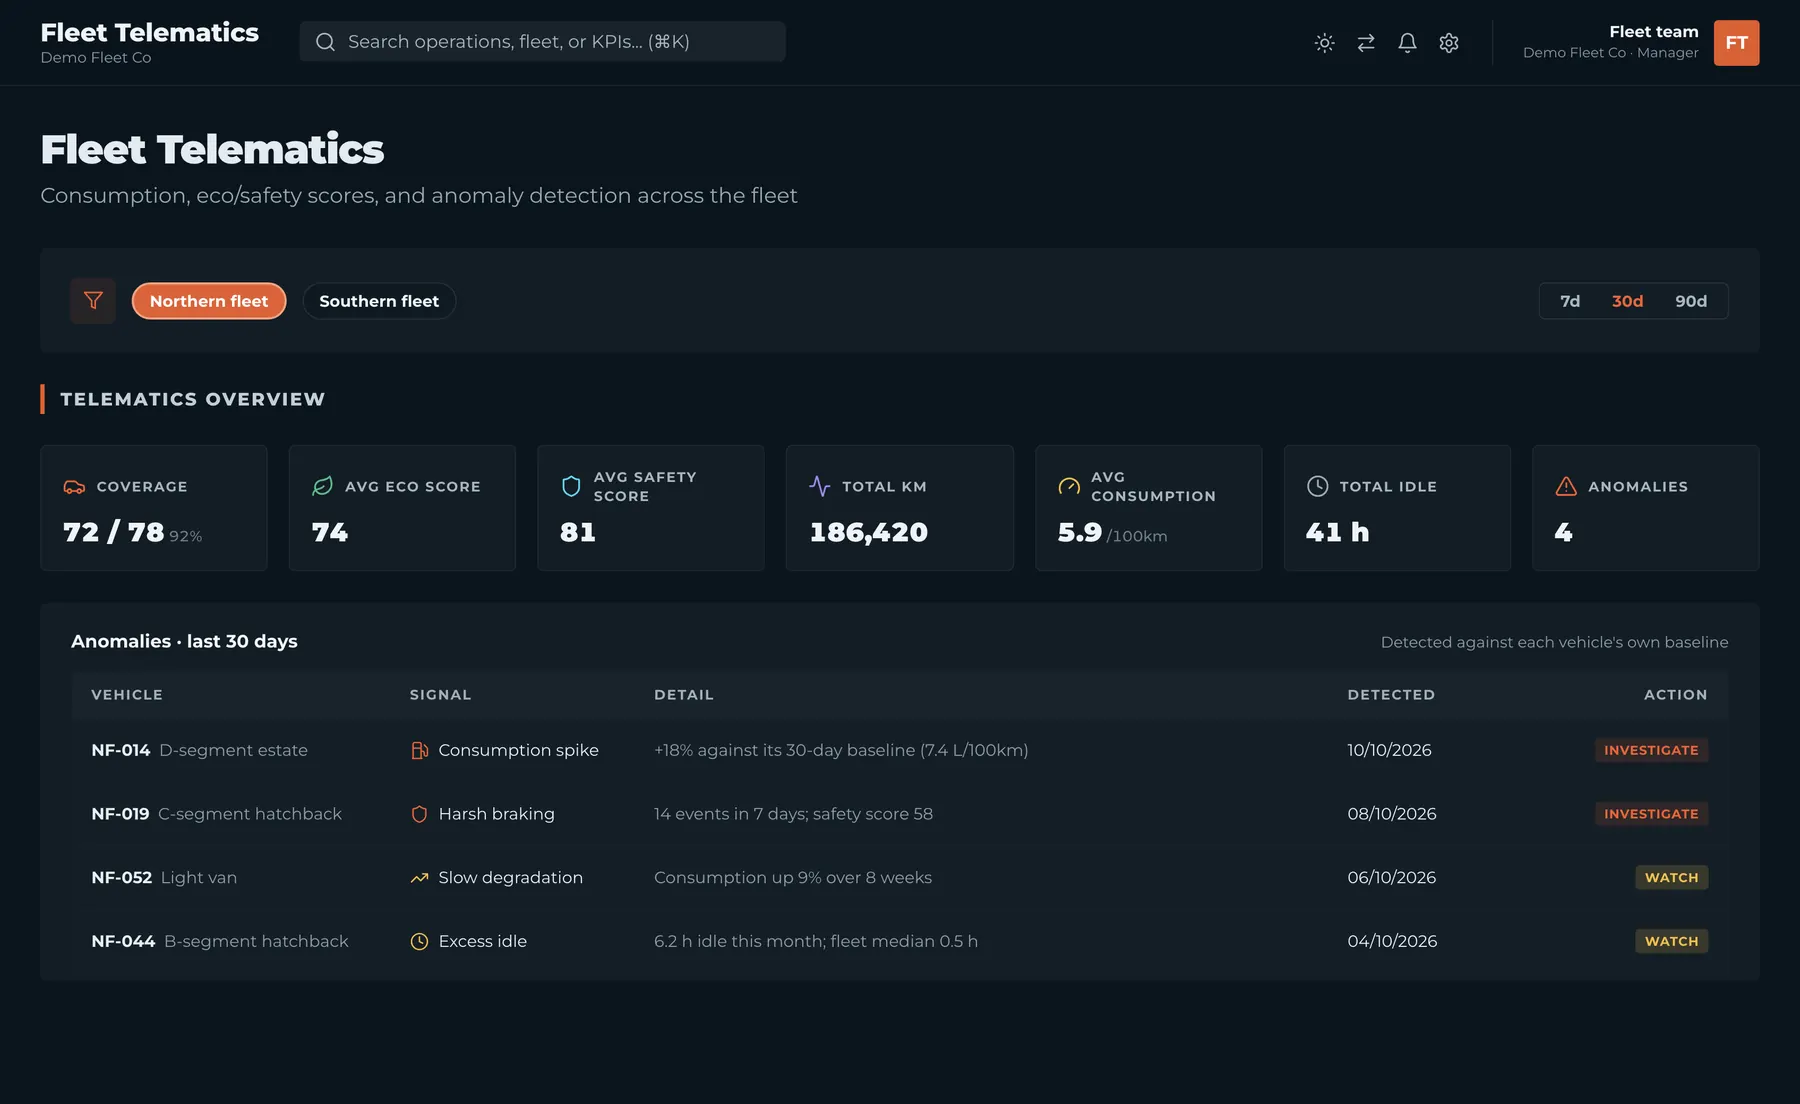
Unusual vehicles flag themselves
Consumption spikes and slow decline are detected from the telematics data, alongside eco-driving and safety scores. A vehicle that behaves oddly shows up as a flag with its evidence, before it costs you.
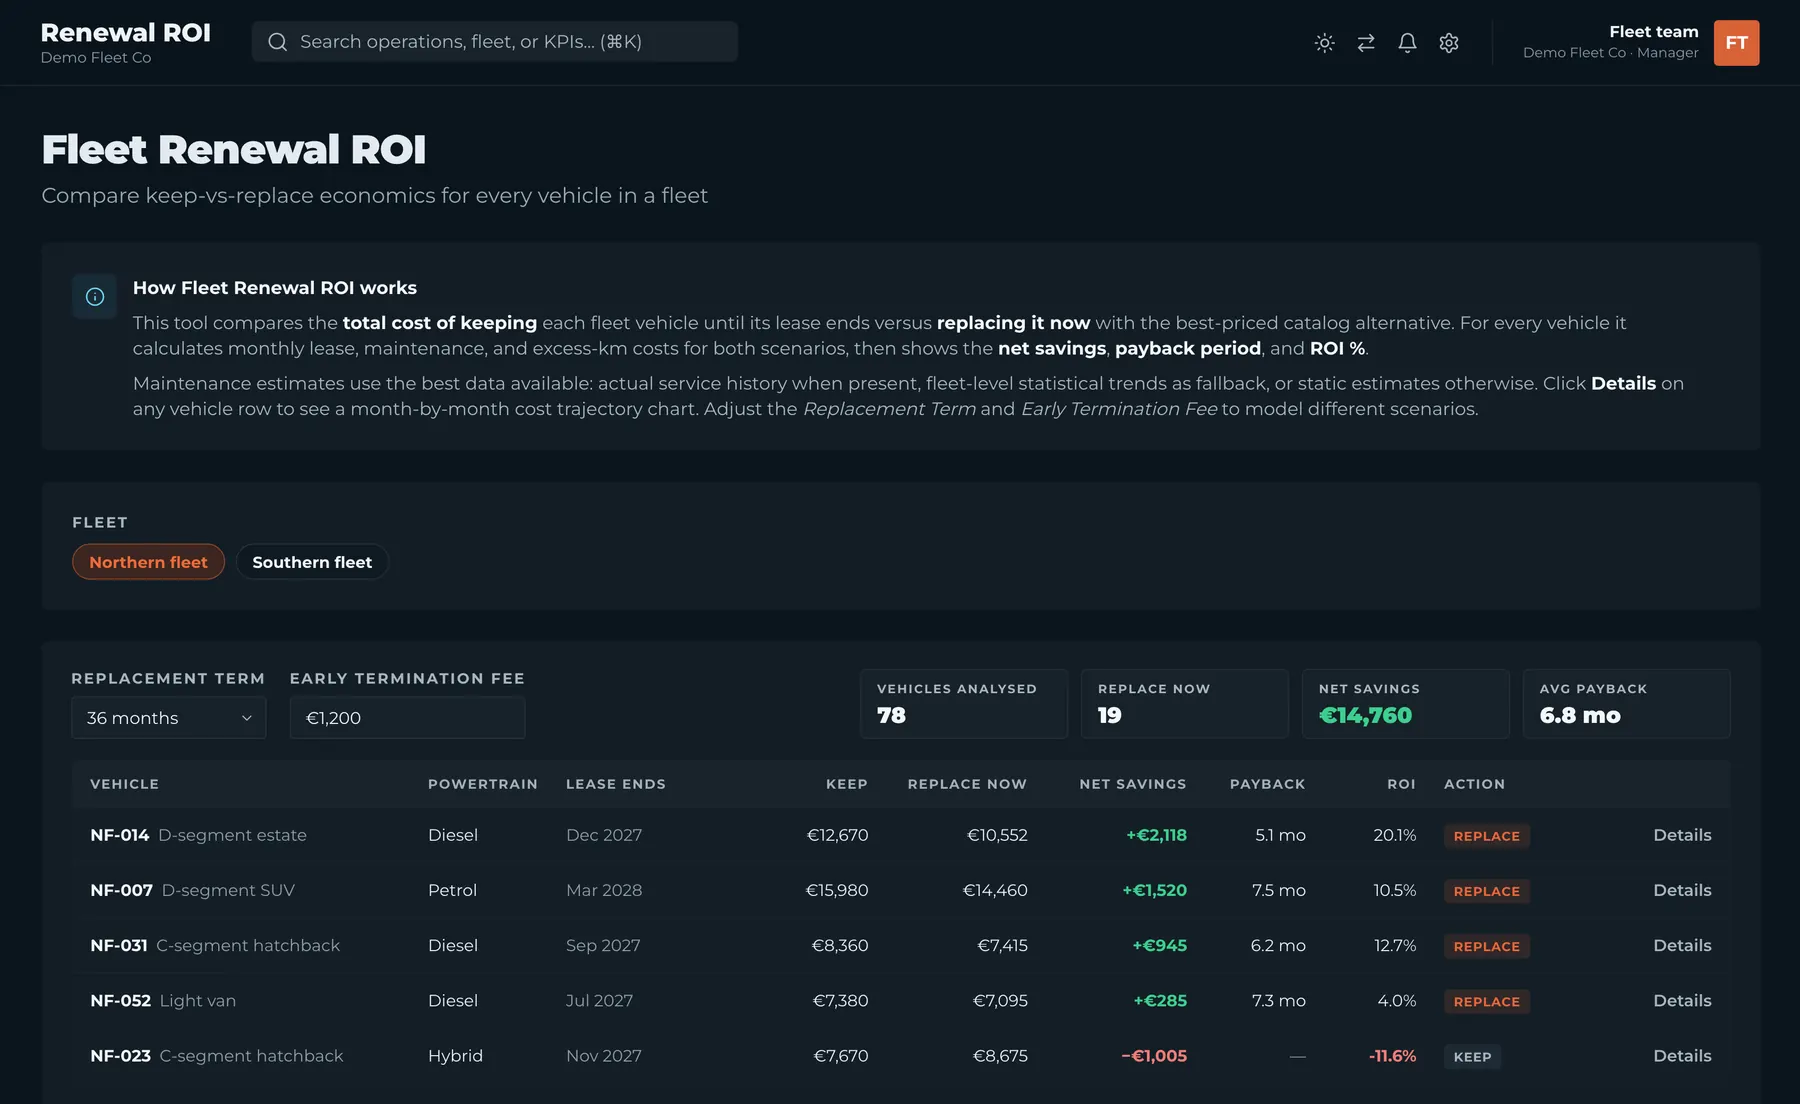
Test your fleet against fuel prices and replacement decisions
Energy scenarios replay your fleet under fuel and electricity price changes, using EU price feeds. The renewal calculator compares keeping and replacing each vehicle, with net savings, payback and ROI, including the case for going electric.
Forecasts, alerts and optimisation built in
Forecasting, anomaly detection and vehicle assignment run automatically, and each result shows how it was reached.
Maintenance cost forecasting
Forecasts per component with confidence bands, explained in plain English, with predictive scheduling of service slots.
Consumption anomaly detection
Detection over the telematics data finds sudden spikes and slow decline, and every flag shows its baseline and its evidence.
Assignment optimiser
Matches drivers to vehicles with the goal you choose: best fit, lowest cost or lowest CO₂.
AI reports and vehicle discovery
Cost and CO₂e reports written for each audience from your real figures, per fleet or combined, plus AI-assisted vehicle discovery with a curated catalogue.
Every forecast can be traced: the inputs, the method and the confidence band come with the number.
Also in the product
- Fleet Health Score: one score per fleet from maintenance, cost trends, telematics and anomalies.
- Administration: users and roles, your organisation's structure and data import.
Know what your fleet really costs
Send us your fleet list. We will show you the cost of each vehicle, the trend and the first renewal decision.